Housing: Slowing, but Not Crashing
The Census Bureau report released this morning showed January New Home Sale were still strong. In fact, on a Not Seasonally Adjusted basis, January 2006 was the strongest January on record.
Following is a graph of NSA January New Home Sales showing 2006 is a new record.

Click on graph for larger image.
The strong sales may be partially due to the generally nice weather in January (a similar argument has been made for the strong retail sales). Also, New Home Sales is a heavily revised number and may be revised down over the next few months.
There is evidence that housing is slowing (see SA graphs: January New Home Sales), but so far there is no “crash”.
In previous housing slowdowns, the “bust” was a slow and steady process that lasted several years. In Housing: After the Boom, I graphed the real and nominal price declines for several cities for previous housing busts. For those examples, the bust lasted 4 to 8 years and the price declines were up to 40% in real terms. I expect this housing bust will be similar in both duration and in the real price adjustment.
The rapidly increasing inventory of New Homes continues to be a major concern. The following graph shows January New Home inventory.
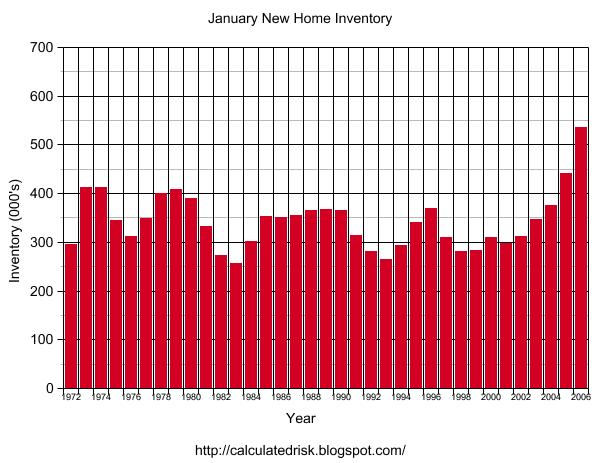
It appears builders have been able to keep inventories down, as compared to sales, until the last couple of years. From the Census report:
The seasonally adjusted estimate of new houses for sale at the end of January was 528,000. This represents a supply of 5.2 months at the current sales rate.
The months of supply is the highest since 1996 (the end of the previous bust). This appears to indicate an oversupply of New Homes for sale.
Best to all, CR Calculated Risk